
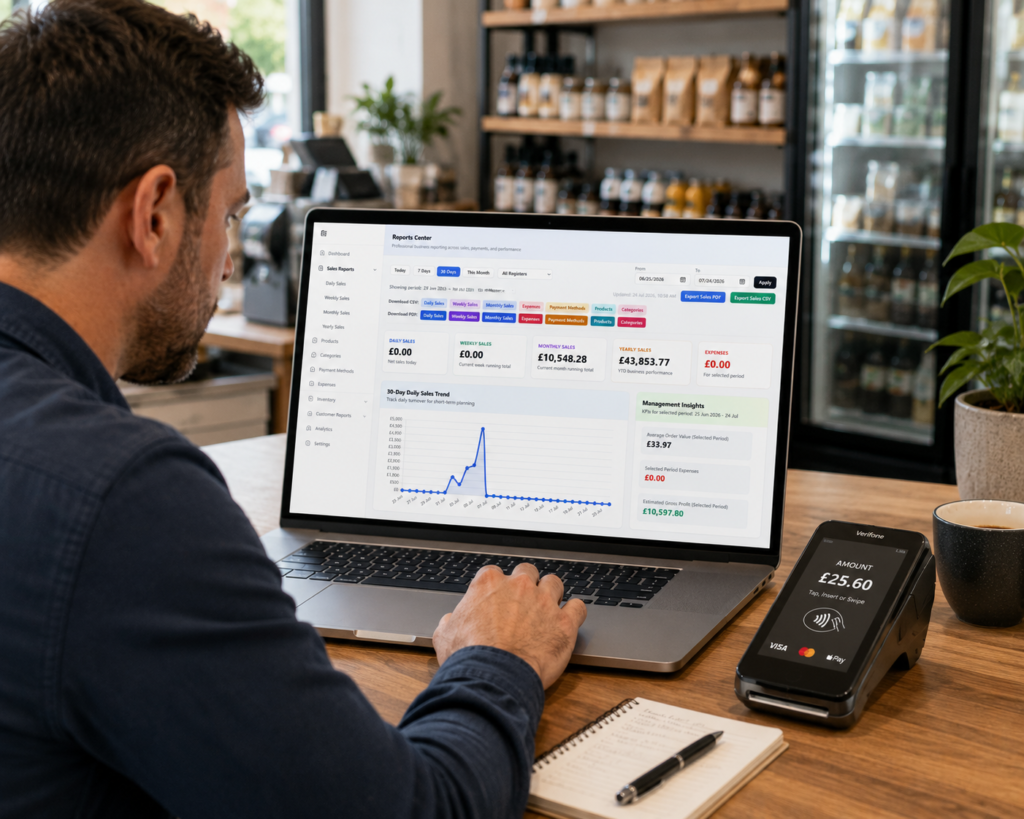
Business owners should check seven essential EPOS reports every day: daily sales, payment methods, average order value, top-selling products, category performance, expenses and estimated gross profit, plus refunds, discounts and other unusual transactions.
You do not need to study every chart in your reporting system each morning. A focused five-to-ten-minute review can reveal whether sales are on target, which products are performing, where money is being taken and whether anything requires immediate attention.
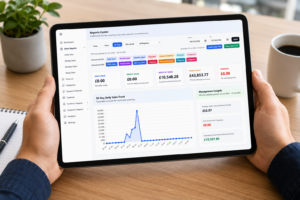
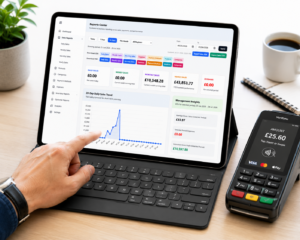
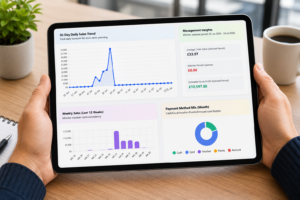
The Switch & Save Reports Centre shown in the screenshots brings daily, weekly, monthly and yearly figures together with sales trends, payment analysis, product performance and management insights. This gives business owners a clearer picture of performance without manually combining information from separate spreadsheets or till records.
Key Takeaways
| EPOS report | What it tells you | Daily action |
|---|---|---|
| Daily sales | Total turnover for the day | Compare with targets and previous trading days |
| Payment methods | Cash, card and other payment contributions | Investigate unexpected payment differences |
| Average order value | Average amount spent per transaction | Identify opportunities to increase basket value |
| Top products | Products generating the most revenue | Protect stock availability and plan promotions |
| Top categories | Strongest and weakest departments | Adjust purchasing, displays or menu focus |
| Expenses and gross profit | Revenue after estimated costs and recorded expenses | Check whether sales are translating into profit |
| Exceptions | Refunds, discounts, voids and discrepancies | Investigate unusual or unauthorised activity |
Why Should Business Owners Check EPOS Reports Daily?
Daily EPOS reporting helps you identify problems while there is still time to act.
Waiting until the end of the month may tell you that sales declined, costs increased or a key product was unavailable. It may not explain exactly when the problem started. A daily review makes it easier to connect performance changes with staff shifts, promotions, weather, local events, stock availability or changes in customer demand.
For example, a grocery shop owner may discover that daily turnover was acceptable but sales of a normally popular fruit category fell sharply. A restaurant manager may see strong revenue but a lower average order value, suggesting customers purchased fewer drinks, desserts or side dishes.
The purpose is not simply to collect numbers. It is to use those numbers to make faster operational decisions.
Switch & Save’s own EPOS reporting and analytics guide explains how sales trends, payment methods, expenses, products and categories can be viewed together to support clearer decision-making. (Switch&Save)
1. Daily Sales Report
The daily sales report should be the first report you check.
It shows how much revenue the business generated during the trading day. Depending on your system, it may also separate gross sales, discounts, refunds, tax, net sales and transaction counts.
What should you look for?
Compare the figure with:
- The same day last week
- Your daily sales target
- Recent trading days
- Expected performance for the season
- Staffing and opening hours
Do not judge performance using revenue alone. A Saturday will normally have a different trading pattern from a Monday, while a bank holiday may not be comparable with an ordinary weekday.
Practical example
A takeaway normally generates £1,500 on Friday evenings but records only £950 this week. The owner can check whether the decline was connected to fewer orders, a temporary delivery problem, reduced opening hours or an important menu item being unavailable.
The earlier the issue is identified, the easier it is to respond before the next busy period.
2. Payment Method Report
Your payment method report shows how revenue was divided between cash, card, vouchers, loyalty points, customer accounts and any other accepted payment types.
The payment mix chart in the Switch & Save Reports Centre gives owners a visual breakdown of each payment method’s contribution.
Why does it need daily attention?
Payment reports help with:
- Cash reconciliation
- Card terminal reconciliation
- Identifying payment entry mistakes
- Planning cash deposits and change
- Understanding customers’ preferred payment methods
- Spotting unusual payment activity
For example, when the EPOS report shows £1,800 in card payments but the terminal settlement report shows £1,650, the difference should be investigated. It may be caused by a refund, transaction recorded under the wrong payment type, delayed payment or reconciliation error.
Businesses using connected checkout and payment technology may benefit from an integrated EPOS and card payment setup, which keeps payment and sales records within a more connected workflow. (Switch&Save)
3. Average Order Value Report
Average order value, often called AOV, tells you approximately how much each customer spends per completed transaction.
It is calculated as:
Total sales ÷ number of transactions = average order value
A business can increase turnover by serving more customers, increasing the average amount each customer spends, or combining both approaches.
What can a falling AOV indicate?
A lower average order value may mean:
- Customers are purchasing fewer items
- Add-on sales are declining
- Lower-priced products are dominating sales
- Promotions are reducing transaction value
- Staff are not consistently recommending extras
A café may have a steady number of customers but notice that AOV has fallen from £11 to £8. The owner might investigate whether fewer customers are purchasing food with their drinks.
A retail store could respond by improving product placement, creating relevant bundles or offering complementary items at checkout. Any promotion should still be reviewed for margin impact rather than being judged only by additional sales.
4. Top-Selling Products Report
The top-products report shows which individual items generated the most sales or revenue during the selected period.
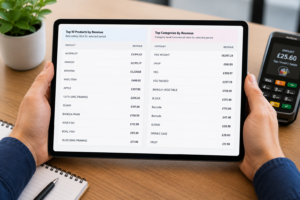
In the attached Switch & Save screenshot, products are ranked by revenue, allowing the owner to identify the items making the largest contribution to turnover.
Questions to ask daily
- Are the expected bestsellers still performing?
- Is a promoted product generating results?
- Are important products close to running out?
- Is one product becoming unexpectedly popular?
- Are high-revenue products also producing a suitable margin?
- Are slow-moving products occupying valuable space?
A top-selling product report becomes particularly useful when linked with stock control. Strong sales are only beneficial when you can maintain availability without ordering excessive quantities.
For more detailed stock planning, see the Switch & Save guide to the role of POS in inventory management. (Switch&Save)
5. Category Performance Report
Product reports show what individual items are doing. Category reports provide a broader commercial view.
A convenience store may monitor categories such as drinks, groceries, tobacco alternatives, household goods and fresh produce. A restaurant may compare starters, mains, desserts, soft drinks and takeaway orders.
How category reports support decisions
Daily category performance can help you decide:
- Where to focus merchandising
- Which sections need replenishment
- Whether a promotion is working
- Which menu areas deserve more attention
- Whether customer demand is changing
- Which categories should receive more purchasing budget
Suppose total sales remain stable, but the drinks category falls while prepared food sales rise. The overall revenue figure may hide this change. The category report makes the shift visible.
Category names and product assignments should also be maintained carefully. Duplicate or unclear categories can divide the same type of revenue across multiple report rows, making analysis less reliable.
6. Expenses and Estimated Gross Profit Report
Revenue is important, but revenue is not the same as profit.
An expenses report records relevant business costs entered into the system, while an estimated gross profit report compares sales revenue with the cost of the products sold.
Why should this be reviewed every day?
A busy business can appear successful while generating an unsatisfactory margin. This can happen when:
- Cost prices are outdated
- Too many discounts are being applied
- Waste is increasing
- Low-margin items dominate sales
- Supplier prices have risen
- Expenses are not being controlled
A restaurant may record strong sales but experience rising ingredient costs. A grocery shop may sell a large quantity of produce but lose margin through spoilage or incorrect cost prices.
Estimated gross profit is only as reliable as the information entered into the EPOS system. Product costs, purchase prices and expense records should therefore be kept current.
7. Sales Trend and Exception Reports
A single sales figure shows what happened today. A sales trend helps explain whether today is part of a wider pattern.
The 30-day daily sales chart shown in the Switch & Save Reports Centre makes peaks, declines and unusual trading days easier to identify.
Check the trend, not only the total
Look for:
- Several consecutive weak days
- Sudden revenue spikes
- Unexpected zero-sales periods
- Changes following a promotion
- Differences between weekdays and weekends
- Seasonal or event-related patterns
You should also review exception activity where available, including:
- Refunds
- Voided sales
- Cancelled orders
- Manual price changes
- Discounts
- Till differences
- Unusually large transactions
These transactions are not automatically evidence of a problem. However, unusual frequency, timing or value should be checked promptly.
A high number of refunds from one register, for example, could indicate a training issue, incorrect product pricing or an internal control concern.
A Simple 10-Minute Daily EPOS Reporting Routine
A practical daily routine could follow this order:
- Check daily net sales against your target and comparable days.
- Review transaction count and average order value to understand what caused the result.
- Reconcile cash and card payments with till and terminal totals.
- Review top products and categories for stock or promotion decisions.
- Check expenses and estimated gross profit to confirm that revenue remains commercially worthwhile.
- Look at the recent sales trend for developing patterns.
- Investigate refunds, discounts, voids and other exceptions before closing the review.
Record any required action. A report has limited value when it is viewed but not acted upon.
Daily Reporting Priorities by Business Type
Retail and grocery shops
Retailers should prioritise daily sales, payment reconciliation, top products, category performance, estimated profit and stock-related information.
Fast-moving products may require immediate reordering, especially before weekends or seasonal demand periods.
Restaurants, cafés and bars
Hospitality operators should focus on sales by trading period, average order value, payment mix, product or menu category performance, discounts and refunds.
They should also compare quieter and busier services rather than relying only on a full-day total.
Takeaways
Takeaways should review order value, product mix, payment methods, discounts and daily sales trends. Where ordering channels are recorded separately, performance should be compared across counter, telephone, online, delivery and collection orders.
Mobile shops and service businesses
Mobile operators should concentrate on daily revenue, transaction value, payment types and product or service performance. Payment reconciliation is especially important when transactions are completed across different locations.
Which EPOS Reports Should Be Checked Weekly or Monthly?
Not every report needs a detailed daily review.
Weekly and monthly reports are better for broader decisions such as:
- Changing suppliers
- Reviewing product ranges
- Comparing staff performance
- Revising menu pricing
- Measuring promotional campaigns
- Planning budgets
- Identifying seasonal patterns
- Evaluating long-term category profitability
Daily reporting is operational. Weekly and monthly reporting is more strategic.
The Reports Centre shown in the screenshots allows the user to switch between daily, weekly, monthly and yearly views and export report data in PDF or CSV format. This makes it possible to perform a quick daily check while retaining more detailed reports for management meetings, bookkeeping or further analysis.
Turn EPOS Reports into Actions
The best EPOS report is not necessarily the one with the most information. It is the report that clearly shows what requires attention.
A useful report should help you answer questions such as:
- Are we selling enough?
- Are customers spending more or less?
- Which products are driving revenue?
- Are our bestsellers available?
- Are sales producing a suitable return?
- Do our payments reconcile?
- Is anything unusual happening?
Switch & Save provides modern EPOS systems for UK businesses alongside card payment solutions and business finance. Its wider service offering is designed to help retailers and hospitality businesses manage sales, payments and day-to-day operations more efficiently. (Switch&Save)
Check Your Business Performance with Switch & Save
Daily EPOS reports give you the information needed to respond earlier, manage costs and make decisions based on actual trading data rather than assumptions.
Switch & Save helps UK businesses reduce costs with AI-powered EPOS systems, card payment solutions and business finance. Check your savings today. (Switch&Save)
Frequently Asked Questions
What is the most important EPOS report to check every day?
The daily sales report is usually the starting point because it shows the business’s immediate trading performance. It should be reviewed alongside transaction count, average order value and payment totals.
How often should an EPOS report be reviewed?
Core operational reports should be checked daily. Broader product, category, staffing and profitability trends can be reviewed in more detail weekly or monthly.
What is the difference between a sales report and a profit report?
A sales report shows revenue generated. A profit report considers relevant product costs and, depending on the report, other expenses. High sales do not always result in high profit.
Why should I check payment methods separately?
Payment method reports help reconcile cash and card totals, identify incorrect payment entries and understand how customers prefer to pay.
Can EPOS reports help with stock ordering?
Yes. Product and category sales reports can highlight fast-moving items and changes in demand. They are most useful when sales reporting is connected with accurate inventory and purchasing records.
Should employees have access to every EPOS report?
Not necessarily. Access should reflect each employee’s responsibilities. Sensitive reports involving profit, expenses, staff performance or management controls may be restricted to owners and authorised managers.
Can EPOS reports be exported?
The Switch & Save Reports Centre shown in the screenshots includes PDF and CSV export options for several reports. Exports can support management reviews, bookkeeping and offline analysis.