POS analytics helps business owners make better decisions by turning everyday sales, payments, products, expenses, and customer activity into clear reports. Instead of guessing which products sell best, which days are busiest, which payment methods customers prefer, or where costs are increasing, a good EPOS reporting dashboard gives you real data you can act on.
For UK retailers, restaurants, cafés, takeaways, bars, grocery shops, and mobile shops, POS analytics can support smarter stock ordering, better staffing, stronger cash flow, improved pricing, faster product decisions, and more accurate business planning.
Switch & Save provides AI-powered EPOS systems, card payment solutions, business finance, and utility switching services to help UK small businesses reduce costs and improve efficiency. With reporting screens like sales trends, revenue comparisons, payment method breakdowns, expenses, top products, and top categories, business owners can see what is really happening in their business and make decisions with confidence.
Key Takeaways
| Area | How POS Analytics Helps |
|---|---|
| Sales performance | Shows daily, weekly, monthly, and yearly sales trends |
| Product decisions | Identifies best-selling and slow-moving products |
| Stock control | Helps avoid over-ordering, under-ordering, and dead stock |
| Payment tracking | Breaks down cash, card, voucher, points, and account payments |
| Cash flow | Gives a clearer view of revenue, expenses, and business health |
| Staff planning | Helps match staff levels to busy days and peak hours |
| Pricing strategy | Shows which products and categories bring the most revenue |
| Business growth | Supports smarter decisions based on real EPOS data |
What Is POS Analytics?
POS analytics is the reporting and data insight side of your POS or EPOS system. Every time a customer buys something, pays by card, uses cash, redeems points, or purchases from a certain category, your system records valuable information.
A basic till only records transactions. A modern EPOS system turns those transactions into useful business insights.
For example, POS analytics can show:
- Which products generate the most revenue
- Which categories perform best
- Which days have the highest sales
- How much money came through cash, card, voucher, points, or account
- How sales compare with the previous year
- How expenses are affecting your profit
- Which weeks are improving or slowing down
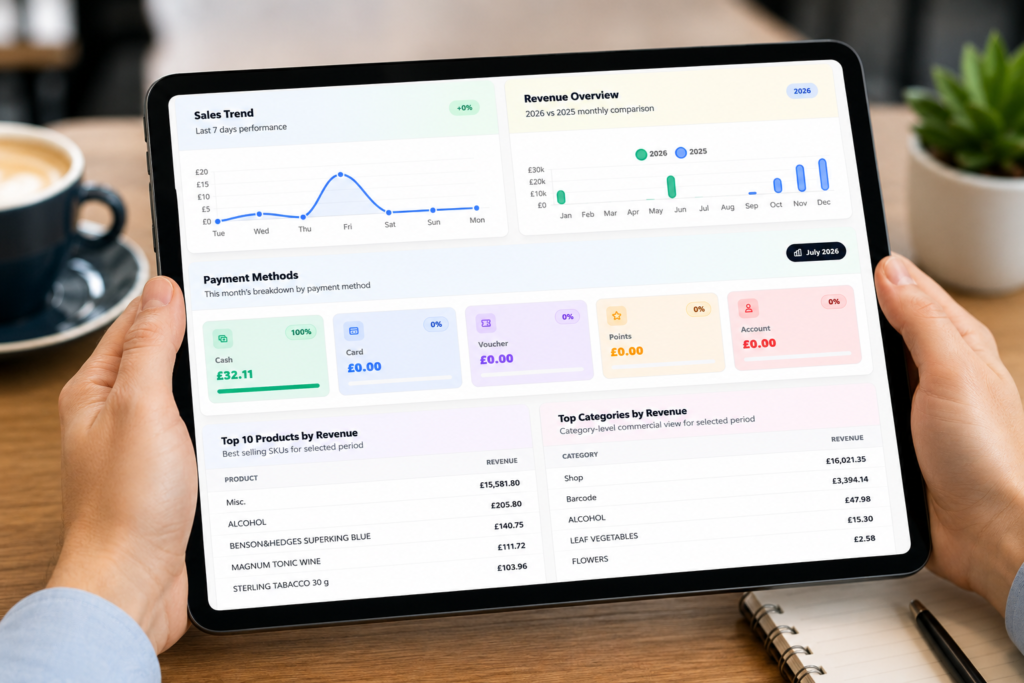
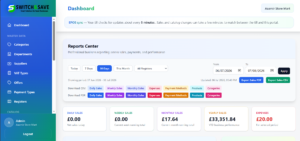
In the Switch & Save EPOS dashboard screenshots, you can see reports such as Sales Trend, Revenue Overview, Payment Methods, Weekly Sales, Expenses Trend, Top 10 Products by Revenue, and Top Categories by Revenue. These are the kind of insights small business owners need to make quicker and more accurate decisions.
Why POS Analytics Matters for UK Small Businesses
Many small businesses still make decisions based on instinct. Experience is valuable, but instinct alone can miss important details.
A shop owner might think Friday is always the strongest day, but the sales trend may show that Wednesday performs better during certain weeks. A restaurant manager may believe card payments are increasing, but the payment method report may show cash still dominates. A takeaway may assume one product is profitable because it sells often, but the revenue report may show another category brings in more money overall.
POS analytics matters because it gives you evidence.
For UK small businesses dealing with rising costs, staff pressure, card payment fees, stock waste, and changing customer habits, clear reporting is not just useful. It can directly affect survival and growth.
A strong POS analytics system helps you answer questions such as:
- What should I order more of?
- Which products should I remove?
- When do I need more staff?
- Which payment method is most used?
- Where am I losing money?
- Which category deserves more promotion?
- Is this month better than last month?
- Are sales improving compared with last year?
For related business efficiency guidance, you can also read: Why Reliable POS Solutions Matter for Your Business and POS Installation Guide for UK Retail and Hospitality
Key POS Reports Every Business Owner Should Use
1. Sales Trend Report
A sales trend report shows how your sales move over time. This could be daily, weekly, monthly, or yearly.
For example, a last 7 days sales trend can show whether sales were flat, whether one day performed much better, or whether weekend trading was weaker than expected.
This helps you decide:
- When to run offers
- Which days need stronger marketing
- When to reduce staff hours
- When to prepare more stock
- Whether a sales spike was normal or unusual
For a café, this might show that Friday lunch is your strongest period. For a convenience store, it may show that midweek sales are weaker and need promotions.
2. Revenue Overview Report
A revenue overview report helps you compare performance over different periods. For example, comparing 2026 vs 2025 monthly revenue can show whether the business is growing, slowing, or becoming seasonal.
This is useful because one good day does not always mean the business is improving. You need to see the bigger picture.
A monthly comparison can help you understand:
- Which months are strongest
- Whether this year is better than last year
- When to prepare for seasonal demand
- When cash flow may become tight
- Whether marketing activity is working
For a grocery shop, December may naturally be strong. For a restaurant, summer months may perform better if there is outdoor seating. POS analytics helps you plan around these patterns.
3. Payment Method Report
A payment method report shows how customers are paying. This can include cash, card, voucher, loyalty points, and account payments.
This is important because payment behaviour affects reconciliation, card processing, cash handling, and customer convenience.
For example, if card payments are increasing, you may want to review your card payment solution and make sure it is reliable, fast, and cost-effective. If cash is still high, you need strong cash management and end-of-day reporting.
Switch & Save supports EPOS and card payment solutions, helping businesses manage transactions more smoothly from the counter to reporting.
You may also find this useful: Upgrading Payments Process: A 2026 Guide for UK Retail
4. Weekly Sales Report
Weekly sales reports help monitor medium-term consistency. A single day can be affected by weather, local events, staff shortages, or one large order. Weekly reporting gives a steadier view.
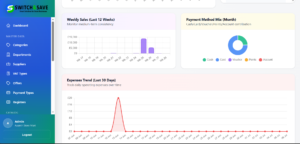
A weekly sales report can help you see:
- Whether sales are improving week by week
- Which weeks are unusually strong or weak
- Whether promotions created a real lift
- Whether stock shortages affected revenue
- Whether the business is becoming more consistent
For mobile shops, takeaways, and restaurants, weekly reporting is especially useful because trading patterns can change quickly.
5. Expense Trend Report
Sales alone do not show the full health of a business. You also need to track expenses.
An expenses trend report helps you monitor operating costs over time. This could include daily expenses, supplier costs, small purchases, or other business outgoings recorded in the EPOS.
If sales are increasing but expenses are increasing faster, profit may still be under pressure.
Expense analytics helps business owners ask:
- Are costs rising unexpectedly?
- Did one day have an unusual expense?
- Are expenses linked to busy trading periods?
- Do I need to review suppliers?
- Is cash flow being affected by regular costs?
This is where Switch & Save’s wider business services can be valuable. Alongside EPOS and payment solutions, Switch & Save also helps with business finance and utility switching, giving business owners more ways to review costs and improve efficiency.
6. Top Products by Revenue Report
A top products report shows which products bring in the most money. This is different from only looking at quantity sold.
A product may sell often but have a low value. Another product may sell less often but generate more revenue.
For example, in a retail shop, tobacco, alcohol, soft drinks, household products, or grocery lines may all perform differently. In a restaurant, burgers, pizzas, meal deals, desserts, and drinks may each contribute differently to revenue.
This report helps you decide:
- Which products deserve better shelf space
- Which items should be promoted
- Which products should stay in stock
- Which products may need price review
- Which products are worth bundling
For small shops, this can make a big difference. Better product decisions can reduce waste, improve stock rotation, and increase revenue from existing customers.
7. Top Categories by Revenue Report
A category report shows which sections of your business are driving sales.
For example:
Shop
Barcode
Alcohol
Leaf vegetables
Flowers
Fruits
Drinks
Food
Desserts
Hot drinks
Category reporting is useful because it gives a commercial view of the whole business, not just individual products.
A grocery store may discover that one category is taking up a lot of shelf space but producing very little revenue. A takeaway may find that drinks and sides are underperforming compared with main meals. A café may see that hot drinks are strong but cakes and snacks need better placement.
This helps owners make decisions about layout, menu design, promotions, and purchasing.
How POS Analytics Improves Business Decisions
Better Stock Ordering
POS analytics helps you order based on actual sales instead of guesswork.
If your top product report shows that certain products sell consistently, you can keep them stocked. If another product is slow-moving, you can reduce ordering or replace it.
This helps avoid two common problems:
Running out of popular products
Keeping too much money tied up in slow stock
For small retailers, better stock control can improve cash flow quickly.
Smarter Staff Planning
Sales trends help you understand when your business is busiest.
A restaurant may need more staff on Friday evening. A convenience store may need more cover during school run hours. A takeaway may need extra kitchen support on weekend nights.
Instead of using the same staff pattern every day, POS analytics helps you match labour to demand.
This can improve customer service while avoiding unnecessary wage costs during quiet periods.
More Accurate Promotions
Promotions should be measured, not guessed.
With POS analytics, you can compare sales before, during, and after a promotion. If a discount increases sales but reduces overall revenue, it may not be worth repeating. If a bundle deal increases basket value, it may be worth continuing.
For example, a café could test a coffee and pastry deal. A takeaway could test a meal deal. A grocery shop could promote a category that is underperforming.
The data will show whether the promotion worked.
Clearer Cash Flow Decisions
Business owners need to know how much money is coming in, how it is being paid, and where costs are going.
POS analytics helps by combining sales reports, payment method breakdowns, and expense tracking.
This supports decisions such as:
When to pay suppliers
When to apply for business finance
When to invest in equipment
When to reduce unnecessary costs
When to review pricing
Switch & Save also supports business finance, which can help small businesses access funding when they need to invest in growth, equipment, or working capital.
Related guide: Business Funding for Small Businesses: Your 2026 Guide
Better Menu and Product Planning
For restaurants, cafés, takeaways, and bars, POS analytics can help improve the menu.
A menu item may look popular, but if it has low revenue or high preparation cost, it may not be as valuable as expected. Another item may have fewer orders but deliver stronger revenue.
For retail, the same logic applies to product ranges. You can review what sells, what does not sell, and what deserves better visibility.
This supports better decisions around:
Menu design
Product placement
Supplier orders
Seasonal ranges
Bundles and meal deals
Category expansion
What to Look for in a POS Analytics Dashboard
A good POS analytics dashboard should be simple enough for daily use but detailed enough for serious decision-making.
Look for:
- Clear sales trend charts
- Monthly and yearly revenue comparisons
- Payment method breakdowns
- Product and category ranking
- Expense tracking
- Easy date filtering
- Readable charts and tables
- Fast reporting without slowing down the till
- Exportable or printable reports
- Support for retail and hospitality operations
The best reporting system is not the one with the most complicated graphs. It is the one that helps you make better decisions quickly.
How Switch & Save Helps UK Businesses
Switch & Save helps UK businesses reduce costs with AI-powered EPOS systems, card payment solutions, business finance, and utility switching services.
For retailers, restaurants, takeaways, cafés, bars, grocery shops, and mobile shops, Switch & Save EPOS can help bring sales, payments, product performance, and reporting into one clearer system.
With POS analytics, you can see what is working, what needs attention, and where your business can improve.
Switch & Save helps UK businesses reduce costs with AI-powered EPOS systems, card payment solutions ans business finance.
FAQs
What is POS analytics?
POS analytics is the reporting feature of a POS or EPOS system. It turns transaction data into useful reports, such as sales trends, payment methods, top products, expenses, and category performance.
Why is POS analytics important?
POS analytics helps business owners make better decisions using real sales and payment data. It reduces guesswork and supports better stock ordering, pricing, staff planning, and cash flow management.
Is POS analytics useful for small shops?
Yes. Small shops can use POS analytics to identify best-selling products, slow-moving stock, busy days, payment trends, and category performance.
Can restaurants use POS analytics?
Yes. Restaurants, cafés, takeaways, and bars can use POS analytics to review menu performance, peak trading times, payment methods, staff planning, and sales trends.
What reports should I check every week?
You should check sales trends, top products, top categories, payment method breakdowns, weekly sales, and expenses. These reports give a clear view of business performance.
Can POS analytics help reduce costs?
Yes. POS analytics can help reduce costs by showing slow-moving stock, unnecessary expenses, poor-performing categories, and inefficient staffing patterns.
Does Switch & Save provide POS analytics?
Yes. Switch & Save provides AI-powered EPOS systems with reporting features designed to help UK businesses make clearer and faster business decisions.