

Retail analytics POS is the practice of turning till data into decisions about stock, staffing and pricing, using your point-of-sale system as the primary data source. It works because every transaction already carries the answer to your biggest questions. The immediate action: check your average transaction value, weekly sales velocity and weeks of stock cover today. Those three numbers alone tell you more about your business than most owners realise.
TL;DR:
- Most retailers should focus on tracking weekly sales velocity, low-stock alerts, and gross margin per SKU to make effective inventory and reordering decisions.
- Clean, standardized POS data across all locations is essential, involving proper SKU mapping, accurate cost prices, and consistent product variants.
- Daily routines analyzing sales and stock levels outperform complex forecasting models for most small and independent stores in their first months.
- Real-time POS dashboards simplify staffing, demand planning, and marketing by providing straightforward, actionable metrics without requiring a data science team.
- Growing retailers can start with basic features like daily sales, low-stock flags, and weekly reorders before gradually adopting advanced predictive and prescriptive analytics.
Table of Contents
- What your POS system actually records (and which numbers matter)
- How retail owners actually use this data day to day
- Descriptive, diagnostic, predictive and prescriptive: pick the right level
- Getting started: fix the data before you fix the dashboard
- A weekly reorder routine that doesn’t need a data scientist
- Best practices that protect your decisions from bad data
- How Switch-and-save supports POS-led retail analytics
- What actually moves the needle in the first 90 days
- Ready to put POS analytics to work in your shop?
- Sources
- FAQ
What your POS system actually records (and which numbers matter)
Every till transaction is a small data file. It captures the SKU sold, the quantity, the price paid, any discount applied, the payment type, which staff member rang it up, the exact timestamp, and which store it happened in if you run more than one site. Most owners never look past the daily total. That’s where the money gets left on the table.
The metrics worth building a habit around are:
- Average transaction value (AOV) — total sales divided by number of transactions, showing whether customers are spending more per visit.
- Units per transaction — how many items land in a typical basket, a direct signal for cross-sell success.
- Sales by hour and day — the backbone of every staffing and opening-hours decision.
- Sell-through rate — the percentage of stock received that actually sells within a set period.
- Sales velocity — units sold per week for a given SKU, the number that drives reordering.
- Gross margin per SKU — because a bestseller with thin margin can matter less than a slow mover with a healthy one.
A quick example: if your sell-through on a new product line sits below 40% after four weeks while a comparable line hit 65%, that’s diagnostic data telling you to discount early rather than let stock sit until the season ends. Oracle’s retail analytics overview frames POS transactions as the anchor data source for exactly this kind of inventory and pricing insight, feeding everything from markdown timing to customer behaviour models.
How retail owners actually use this data day to day
POS analytics earns its keep in five practical areas, and none of them need a data science team.
- Inventory and replenishment. Tracking sell-through by SKU flags slow movers before they become clearance stock and fast movers before they run out. A shop that spots a 20% week-on-week sales jump on a product can reorder before a stockout costs it a week of sales.
- Demand forecasting. Historical sales by week and season let you plan orders and promotions with confidence rather than guesswork, particularly around known peaks like Christmas or back-to-school.
- Staffing optimisation. An hourly sales report shows exactly when footfall and spend peak, so you can roster staff against demand instead of habit.
- Merchandising and product affinity. POS basket data reveals which items sell together, informing bundle offers and shelf placement.
- Marketing and retention. Linking POS purchase history to a CRM or email platform lets you target repeat buyers with relevant offers instead of blanket discounts.
Shopify’s guidance on POS data analysis points out that retailers unifying POS with ecommerce and marketing systems make noticeably sharper inventory and marketing calls than those running each system in isolation.
Descriptive, diagnostic, predictive and prescriptive: pick the right level
Retail analytics splits into four types, and each answers a different question. Descriptive analytics tells you what happened: last week’s sales by hour, last month’s top ten SKUs. Diagnostic analytics asks why: why did Saturday’s footfall drop, why did that SKU’s margin slip.
Predictive analytics estimates what happens next, using velocity and seasonality to forecast the coming month’s demand. Prescriptive analytics goes further, recommending or automating the action itself, such as a system that generates purchase orders once stock cover falls below a threshold.
Most independent retailers get the biggest return from mastering descriptive and diagnostic analytics first. A simple weekly sales-by-hour report, read consistently, usually beats an unused forecasting model. Practitioner analysis of POS data backs this up: disciplined routines built on clean, simple metrics tend to outperform early investment in complex predictive tools for most retail operations. Save the automation for once the basics are running smoothly.
Getting started: fix the data before you fix the dashboard
A dashboard built on messy data will mislead you faster than no dashboard at all. Before anything else, run a data hygiene pass:
- Standardise SKU codes across all locations so the same product isn’t tracked under three different identifiers.
- Confirm cost prices are accurate and current, otherwise margin figures will be fiction.
- Map product variants (size, colour) consistently so sell-through reports aggregate correctly.
Once the data is trustworthy, prioritise integrations in this order: inventory management first, then ecommerce if you sell online, then loyalty or CRM, then payments reporting. Choosing a POS system with strong native integrations saves months of manual reconciliation later.
Build a minimal starter dashboard covering daily sales, weekly velocity per SKU, and a low-stock flag for anything below its reorder point. Then set a cadence: check daily KPIs each morning, run a weekly reorder meeting, and do a monthly assortment review to cut dead stock and expand what’s working.
Pro Tip: Don’t build ten dashboards at once. Get the daily sales and low-stock flag working perfectly first. Everything else can wait a month.
A weekly reorder routine that doesn’t need a data scientist
Demand forecasting sounds intimidating until you strip it down to four numbers per SKU: weekly velocity (units sold per week, averaged over 4 to 8 weeks), weeks of cover (current stock divided by weekly velocity), a trend indicator (is velocity rising or falling), and a seasonality multiplier for known peaks.
From there, a simple reorder point formula works: reorder point equals weekly velocity multiplied by your lead time in weeks, plus a safety buffer. If a SKU sells units steadily each week and your supplier takes a couple of weeks to deliver, your reorder point is calculated by multiplying weekly sales by lead time plus a buffer to protect against demand spikes.
Practitioner guides on retail demand forecasting recommend exactly this four-number approach, paired with a weekly operating rhythm:
- Pull the SKU-level velocity report every Monday.
- Flag anything below its reorder point or showing an unusual trend shift.
- Investigate outliers (was there a promotion, a competitor closure, a weather event).
- Place orders, bundling where suppliers offer volume discounts.
The routine has real limits. It struggles with brand-new SKUs that have no sales history, and it can’t anticipate external shocks like a viral social post or a sudden supplier delay, so treat the reorder point as a floor, not gospel.
Best practices that protect your decisions from bad data
The single biggest failure mode in POS analytics isn’t a missing feature. It’s fragmented truth: three systems, three different sales totals, and nobody trusting any of them. Analysis of common POS data pitfalls identifies this siloed-reporting problem as the most common reason retailers abandon data-driven decisions within months.
A few rules keep the data honest:
- Build one connected data layer as your single source of truth rather than exporting to separate spreadsheets nobody reconciles.
- Correct historical sales figures for stockout periods, otherwise you’ll underestimate true demand for anything that ran out.
- Maintain per-store profiles rather than blending multi-site data into one average that hides local patterns.
- Check top-SKU stock levels daily, not weekly, since your bestsellers cause the most damage when they run out.
- Watch for refund handling, cost misalignment after supplier price changes, and variant mapping errors, all of which quietly corrupt margin reports.
How Switch-and-save supports POS-led retail analytics
AI-enabled EPOS systems combine hardware, cloud-based software and integrated payments, with real-time dashboards that surface sales, stock and staffing data as it happens. Multi-store and multi-terminal support allows retailers running several sites to see everything from one login rather than reconciling exports by hand.
Retail, hospitality, standard and premium packages let business owners start at an appropriate scale. Packages often include demos and support to help ensure setup and staff training do not delay initial reorder routines. If you’re weighing up which POS analytics setup fits your operation, that can be a practical starting point.
What actually moves the needle in the first 90 days
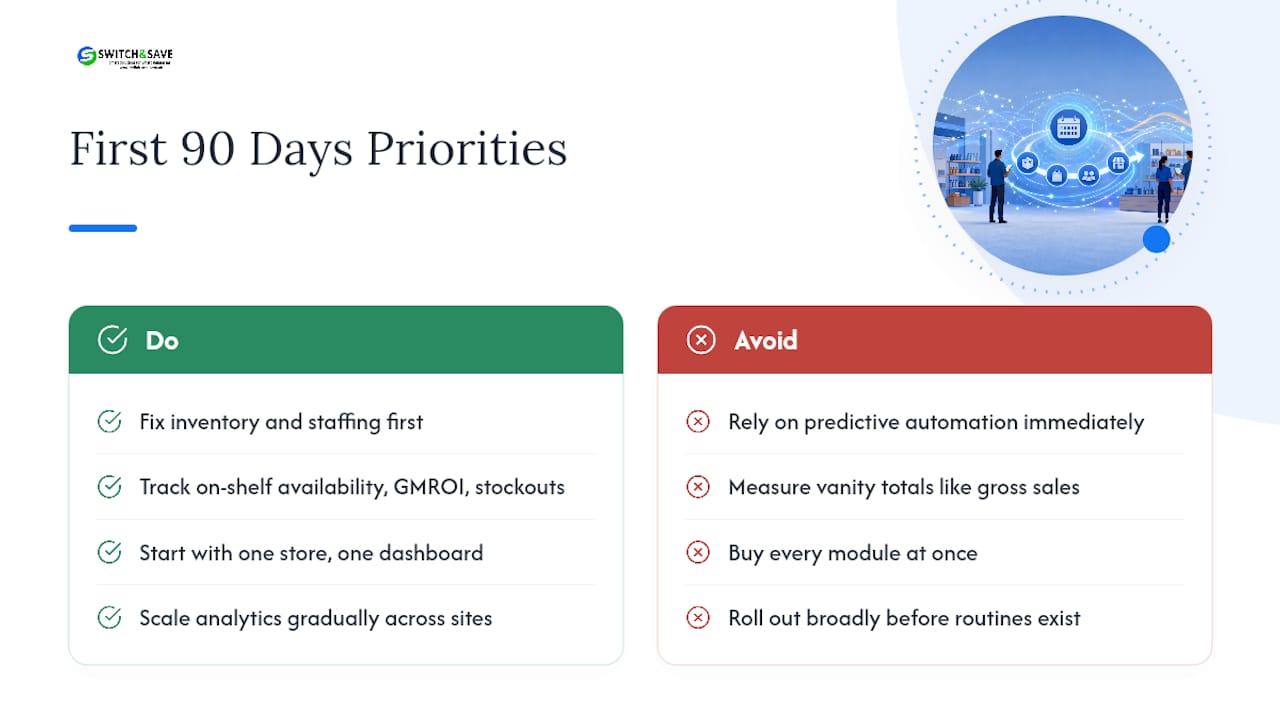
Inventory fixes and staffing adjustments pay off fastest, often within four to six weeks, because they respond directly to data you already have. Predictive forecasting and prescriptive automation take longer to trust and are worth building once the basics are solid.
Track on-shelf availability, GMROI (gross margin return on inventory) and stockout rate as your core success measures rather than vanity totals like gross sales. Start with one store, one dashboard and one weekly routine before rolling out across sites. Retailers who scale analytics capability gradually tend to keep it running; those who buy every module at once often abandon most of it within a quarter, echoing what the BRC’s sector analysis found about organisational routines mattering more than tooling.
— Amir
Ready to put POS analytics to work in your shop?
If you’ve read this far, you already know the gap isn’t ambition, it’s tooling that actually surfaces the numbers without a manual export every Monday morning. Switch-and-save’s retail EPOS systems build real-time sales and stock dashboards straight into the till, so weekly velocity and low-stock flags are already sitting there when you open your laptop, no spreadsheet gymnastics required.
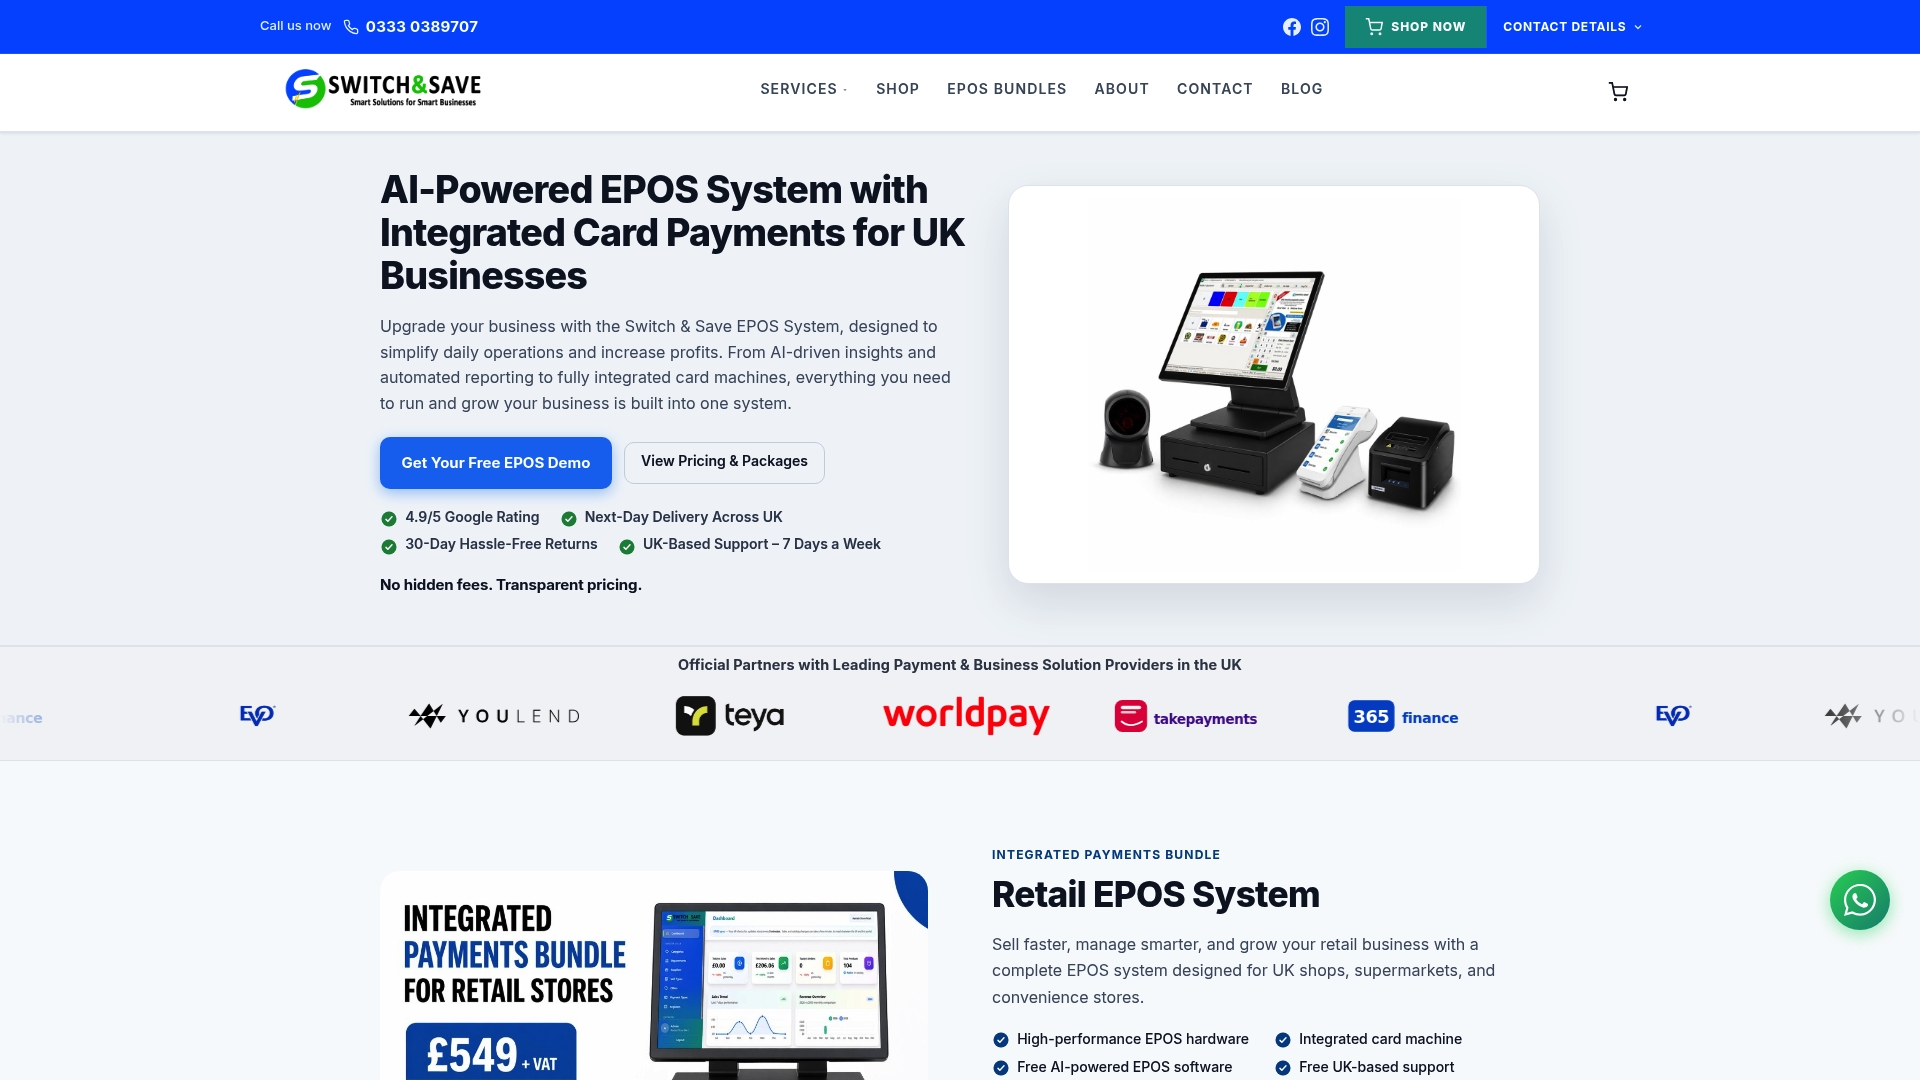
A single-site shop starting out might choose a standard package, while multi-site retailers could benefit from multi-store reporting and remote dashboard access offered by more advanced packages. Packages often include demos and support to help ensure teams are trained and reorder routines start promptly. Browse available EPOS systems or check local installation and support options, then consider booking a demo to see your till data on a dashboard before committing.
Sources
- What Is Retail Analytics? The Ultimate Guide
- Demand Forecasting for Retail: Turn POS Data into Stock Decisions
FAQ
What POS system is best for retail?
The best system depends on store count and stock complexity, but look for real-time sync, SKU-level sales history and multi-store reporting as non-negotiables. Systems like Switch-and-save’s retail EPOS range bundle these features with UK-based support for faster setup.
What is retail analytics?
Retail analytics is the practice of turning sales, stock and customer data, primarily from your POS system, into decisions about pricing, inventory, staffing and marketing. It ranges from simple descriptive reports to predictive forecasting.
What are the five types of POS systems?
Common categories include terminal-based systems, mobile or tablet POS, self-service kiosks, cloud-based systems, and multi-lane systems for larger stores. Most modern retailers now favour cloud-based systems for their real-time reporting and remote access.
What are the five P’s in retail?
The five P’s are usually defined as product, price, place, promotion and people, the core levers retailers adjust to drive sales. POS analytics directly informs three of these: product performance, pricing decisions and promotional timing.
How does retail analytics work in practice?
It works by pulling transaction-level data from your POS, tracking KPIs like sales velocity and sell-through, and reviewing them on a set cadence, daily for stock alerts, weekly for reordering, monthly for assortment decisions. The routine matters more than the sophistication of the tool.