

AI inventory forecasting improves demand accuracy and cuts carrying costs, and it does so consistently enough that most retail and hospitality businesses can justify a small pilot within a single quarter. Research on AI-driven demand models found a 31.2% average reduction in forecast error (MAPE), alongside a 24.7% rise in inventory turnover when advanced models replaced traditional statistical forecasting. Separately, Databricks reports that recalculating safety stock against real-time demand volatility, rather than static annual formulas, reduces both carrying and fulfilment costs.
The sensible next step isn’t a full system overhaul. It’s a scoped pilot on a handful of SKUs where you can measure the difference within weeks.
- Pick 20 to 50 SKUs across two or three categories with reliable sales history
- Set a baseline MAPE and fill rate before you switch anything on
- Run the AI forecast alongside your current method for at least one full sales cycle
- Compare carrying cost and stockout rate at the end, not just accuracy
Key Takeaways
AI inventory forecasting works because it replaces static, backward-looking formulas with models that recalculate demand and safety stock continuously against real conditions.
| Point | Details |
|---|---|
| Accuracy gains are measurable | Advanced models cut forecast error by 31.2% on average and lift inventory turnover by 24.7%. |
| Start with a scoped pilot | Test on 20 to 50 SKUs with clean history rather than rolling out across the full catalogue. |
| Hybrid models perform best | Combine ML forecasts with optimisation constraints for lead times and storage limits. |
| Data latency under 24 hours matters | Slow POS feeds blunt the model’s ability to react to sell-through and promotions. |
| Governance prevents costly errors | Keep human sign-off on large order changes and monitor for model drift monthly. |
| Switch-and-save provides the data foundation | Real-time, multi-store POS data and centralised SKU tracking prepare a business for a forecasting pilot. |
Table of Contents
- What is AI inventory forecasting and why it beats static formulas
- How AI forecasting works: models and the hybrid pattern
- Implementation checklist and pilot plan for managers
- What data and integrations does AI forecasting actually need?
- What risks and governance controls should you plan for?
- How Switch-and-save supports a practical forecasting pilot
- Sources
- FAQ
What is AI inventory forecasting and why it beats static formulas
AI inventory forecasting uses machine learning models to predict future demand from historical sales, seasonality, promotions and external signals, then feeds those predictions into replenishment decisions. IBM’s overview of AI inventory management frames the core use cases plainly: demand forecasting, anomaly detection and automated replenishment, all working from the same underlying signal.
The difference from traditional forecasting isn’t marginal. Classic methods, moving averages, exponential smoothing, static reorder points, assume demand behaves the way it did last year. AI models instead learn patterns from thousands of data points and adjust as conditions shift, which is precisely why they outperform when demand is volatile or seasonal.
Statistic callout: Studies of advanced forecasting models report a 31.2% average MAPE reduction, a 24.7% increase in inventory turnover, and a 19.4% reduction in required safety stock compared with traditional statistical baselines.
The benefits compound across three areas that matter to anyone managing stock:
- Fewer stockouts — better demand sensing catches spikes before they cause empty shelves
- Lower carrying costs — safety stock shrinks when forecasts are more precise
- Higher inventory turns — capital moves through the business faster instead of sitting on a shelf
Three use cases tend to produce the fastest return. Perishable goods benefit because even small forecast errors translate directly into waste or lost sales. Promotional planning benefits because AI models can factor in past uplift patterns that spreadsheets rarely capture well, as detailed in Performance Max strategies for seasonal events – Oxedent. Omnichannel reallocation benefits because moving the right stock between stores or channels depends on demand signals that update daily, not monthly.
When choosing pilot SKUs, favour products with steady sell-through, moderate seasonality, and at least a year of clean sales history. Avoid brand-new lines or extremely low-volume products at first. There won’t be enough data for the model to learn anything meaningful.
How AI forecasting works: models and the hybrid pattern
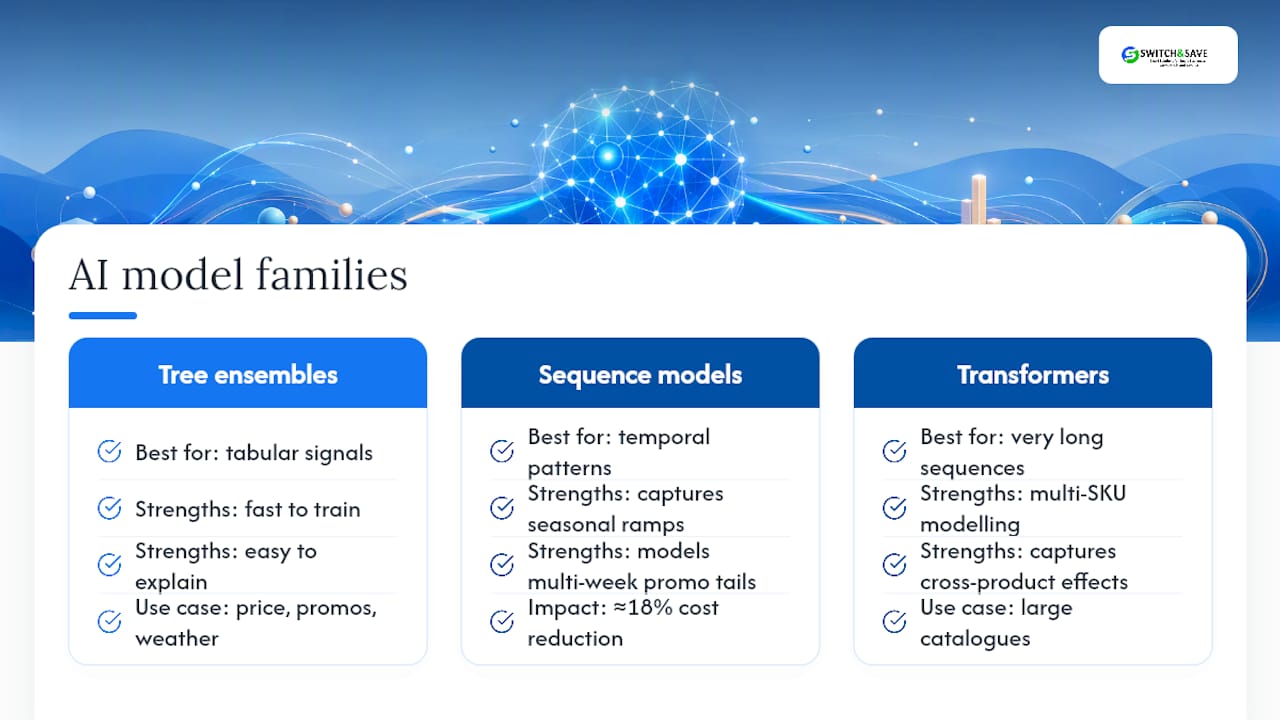
Three families of model dominate AI inventory forecasting today, and each suits a different demand pattern.
Tree ensembles (XGBoost and similar gradient-boosted methods) handle tabular data well, mixing price, promotion flags, weather and day-of-week into a single prediction. They’re fast to train and easy to explain, which matters when you need to justify a reorder decision to a finance director.
Sequence models (LSTM networks and Temporal CNNs) capture patterns that unfold over time, such as a slow seasonal ramp or a multi-week promotional tail. Research modelling these architectures through an inventory-impact simulator found Temporal CNN and LSTM models achieved up to an 18% cost reduction and close to a 10 percentage-point improvement in fill rate, according to an end-to-end forecasting and inventory optimisation study.
Transformers, adapted from natural language processing, handle very long sequences and multiple related SKUs at once, useful for large catalogues with cross-product cannibalisation effects.
In practice, few businesses run a single model type in isolation. The literature on hybrid forecasting increasingly recommends combining a statistical or ML baseline with an optimisation layer that enforces real-world constraints, lead times, supplier minimums, storage capacity, rather than treating the forecast as the final answer. A related view from Swansea University’s research on hybrid AI for optimisation puts it well: the strongest architectures pair machine learning for volatile demand signals with optimisation modules that respect capacity and lead-time limits.
This is also why raw MAPE alone is a poor scoreboard. A forecast can look statistically accurate and still produce poor stock decisions if it ignores fill rate or cost. Multi-echelon studies show forecast quality at distribution centres disproportionately affects downstream fill rates, which is why evaluating through an inventory-impact simulator beats judging a model on accuracy metrics alone.
Pro Tip: Ask any vendor to show forecast accuracy AND simulated fill rate and cost impact together. A model that’s 5% more accurate but ignores your minimum order quantities can still cost you money.
Implementation checklist and pilot plan for managers
Running a credible pilot means treating it as a small project with a defined scope, not an experiment you’ll get to eventually.
- Define scope, horizon and KPIs. Pick your SKU set, decide whether you’re forecasting daily, weekly or monthly demand, and fix target metrics upfront: MAPE, fill rate, inventory days, and carrying cost.
- Prepare your data. Pull at least 12 to 24 months of sales history, confirm SKU mapping is consistent across systems, and check that promotional and pricing history is tagged correctly.
- Build the pipeline. This covers feature engineering (seasonality, promotions, weather where relevant), model selection, backtesting against historical periods, and a deployment path that pushes forecasts into your replenishment system.
- Monitor continuously. Set up drift detection so you know when the model’s assumptions stop matching reality, not just when someone notices a stockout.
- Roll out and evaluate. Run the pilot for a full sales cycle, ideally including at least one promotional period, then compare against baseline KPIs before deciding whether to scale.
Statistic callout: Industry summaries cited by Databricks suggest AI-driven forecasting can reduce fulfilment costs and carrying costs significantly, figures worth using as benchmarks rather than guarantees when building your pilot’s business case.
Set your decision criteria before the pilot starts, not after you see the results. Agree with finance and operations in advance what improvement in fill rate or carrying cost justifies wider rollout. Without that agreement, a genuinely good pilot can stall in committee simply because nobody defined success beforehand.

Keep the pilot’s data pipeline as close to your production environment as realistically possible. A pilot that works beautifully on a clean, hand-curated dataset but falls apart against live, messy POS feeds tells you very little about what will happen at scale.
What data and integrations does AI forecasting actually need?
Forecast quality is bounded by data quality, and the single highest-return precondition, according to Swansea University’s research, is consistent SKU identifiers feeding from centralised POS and ERP systems. Without that, every downstream model decision is built on shaky ground.
At minimum, your pipeline needs:
- Point-of-sale transaction data at SKU level, ideally refreshed within 24 hours
- Current and historical stock levels across every location
- Supplier lead times and delivery reliability history
- Promotional calendars and pricing changes
- Store or channel identifiers that stay consistent over time
Latency matters more than most managers expect. A step-by-step implementation guide for AI demand forecasting recommends keeping data latency under 24 hours so the model can react to sell-through and promotional effects while they’re still relevant, rather than forecasting against last week’s picture.
The typical integration pattern runs POS systems into a central data warehouse, which feeds the model pipeline, which then pushes recommendations back into your replenishment or ordering workflow, with monitoring dashboards sitting across the whole chain. If your current setup relies on exporting spreadsheets from separate tills, that gap needs closing before AI forecasting will produce anything trustworthy. Our guide to inventory tracking essentials for retail and hospitality covers the groundwork in more detail.

Pro Tip: Before you evaluate any forecasting tool, audit whether your SKU codes match across your POS, ERP and supplier systems. Mismatched identifiers are the single most common reason pilots stall.
What risks and governance controls should you plan for?
AI forecasting isn’t risk-free, and pretending otherwise sets a pilot up to lose trust the moment something goes wrong.
Bullwhip risk is real: an overly responsive model can amplify small demand blips into large order swings up the supply chain. Temper this by constraining how much the model’s recommendation can shift week to week without a human sign-off. New SKUs pose a cold-start problem too, with too little sales history for the model to learn from, so lean on category-level forecasts and analogous-item comparisons until enough history builds up.
Applied research on AI in supply chain management flags data fragmentation, skills gaps and black-box scepticism as recurring barriers to adoption, which is exactly why governance can’t be an afterthought.
- Keep a human-in-the-loop for any recommendation above a defined order value or percentage change
- Monitor for model drift monthly, not just at deployment
- Set a retraining cadence, quarterly is common, rather than leaving a model static indefinitely
- Require explainability: know which factors drove a given forecast, not just the number itself
How Switch-and-save supports a practical forecasting pilot
Reliable AI forecasting depends on the same foundations covered above: timely POS feeds, consistent SKU identifiers, and centralised visibility. Switch-and-save’s EPOS platform is built around exactly that.
- Real-time sales data across every till, so demand signals aren’t stale by the time they reach a model
- Multi-store support with centralised SKU identifiers, removing the mapping headaches that stall most pilots
- A cloud dashboard giving remote, consolidated visibility across locations for monitoring and drift checks
Pro Tip: Start your pilot on the stores or SKUs where your Switch-and-save data is cleanest. A tidy dataset from one strong location beats messy data from ten.
Explore the practical mapping between EPOS data and forecasting pipelines in our guide to AI-driven EPOS systems.
A pragmatic note on getting this right
Most AI forecasting pilots fail not because the model is weak, but because the underlying data was never clean enough to trust in the first place. The right attitude is to start small, measure honestly against a real baseline, and only scale once the numbers hold up under pressure.
— Amir
Get a pilot running with Switch-and-save
Switch-and-save gives you a faster route to forecast-ready data than building a custom pipeline from scratch, because the sales and inventory feed your model needs is already structured and centralised from day one. Rather than spending months reconciling till exports and spreadsheets, you start with real-time, multi-store data already flowing into one dashboard.
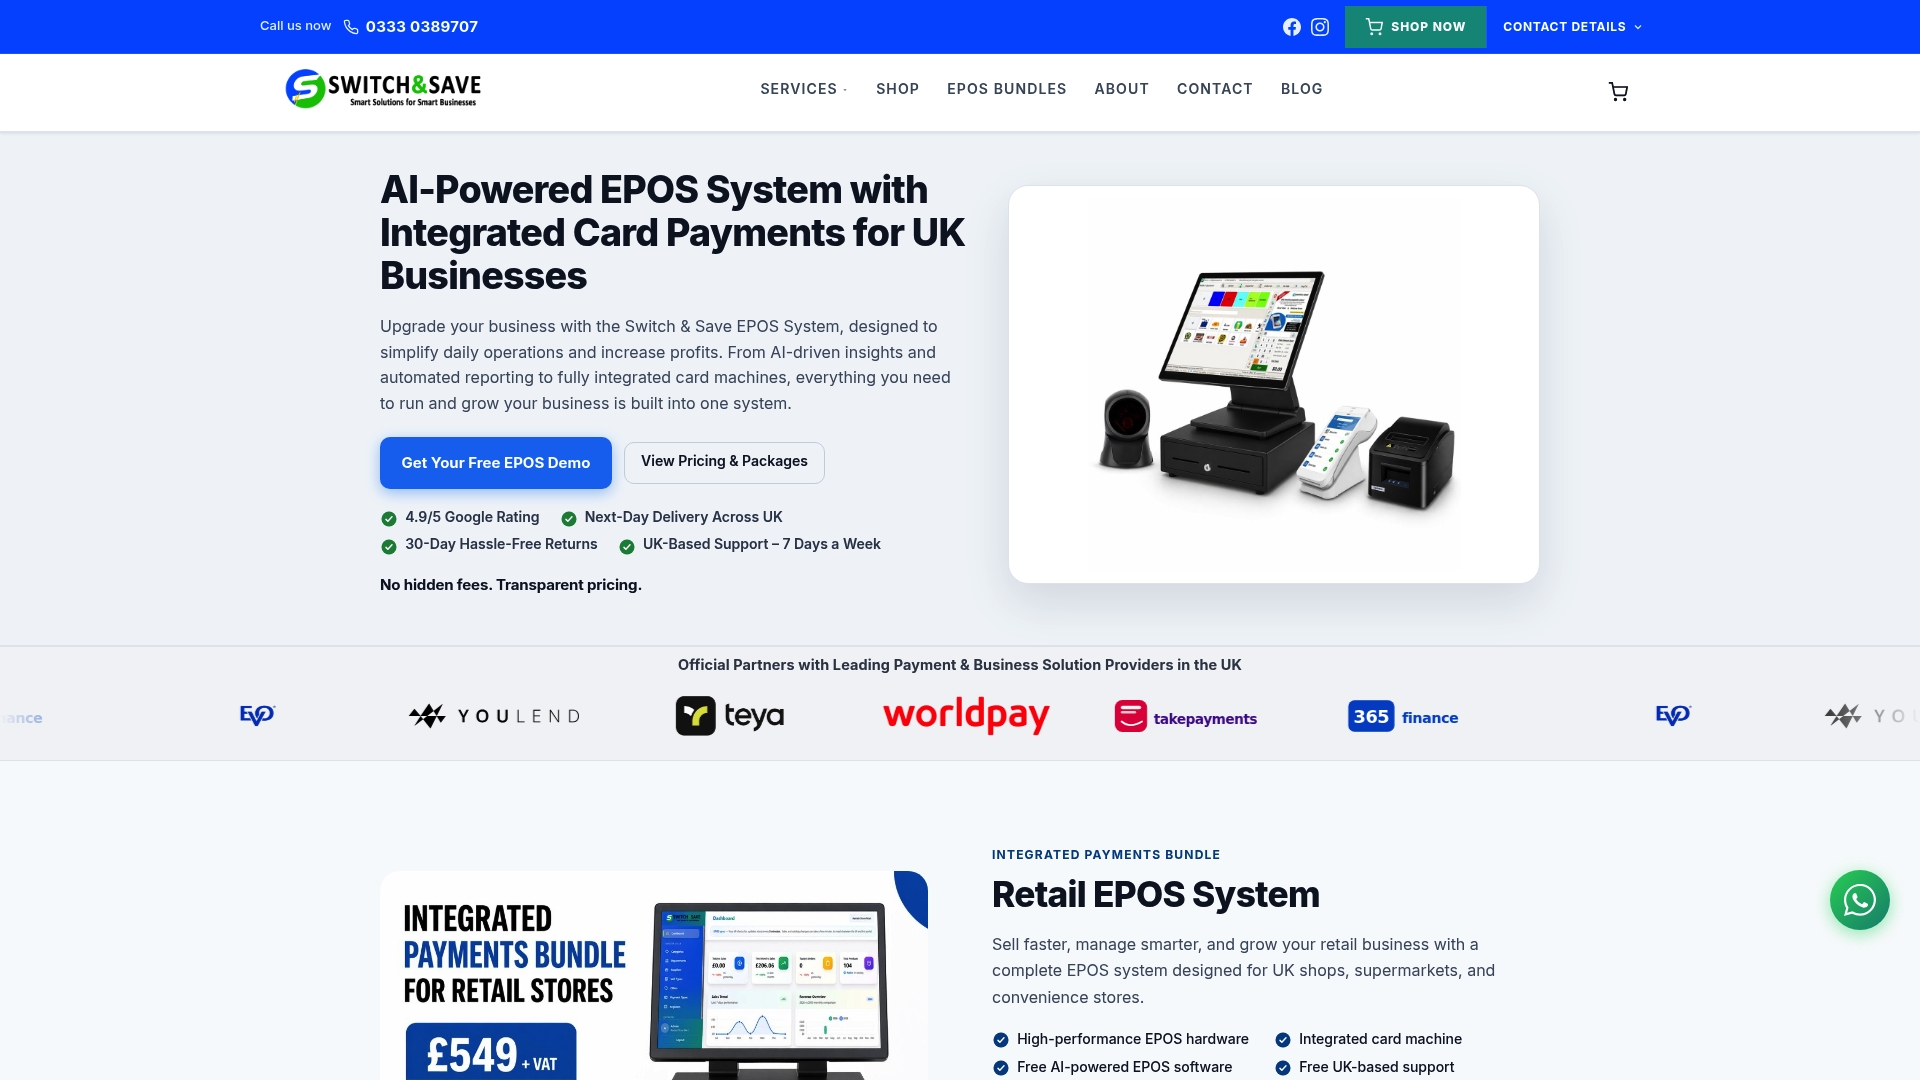
The SSPOS software behind Switch-and-save’s EPOS packages covers the retail and hospitality features a forecasting pilot depends on: consistent SKU tracking, real-time stock visibility, and multi-store reporting, all accessible through UK-based support if something needs troubleshooting mid-pilot. For businesses managing perishable stock, the hospitality EPOS system adds features suited to fast-moving, time-sensitive inventory.
Request a free demo to see how your current sales data maps onto a forecasting-ready pipeline, and get a straight answer on what a small pilot would look like for your business.
Sources
- AI in supply chain | Databricks Blog
- AI-Driven Demand Forecasting and Its Impact on Inventory Optimization — SocArXiv
- Hybrid approaches in AI forecasting — Frontiers in Big Data
- End-to-end forecasting–inventory optimization pipeline (arXiv)
FAQ
What accuracy improvement can AI forecasting realistically achieve?
Research on advanced models reports an average 31.2% reduction in forecast error compared with traditional statistical methods, alongside gains in inventory turnover.
Do I need a data scientist to run an AI forecasting pilot?
Not necessarily. Many EPOS platforms, including Switch-and-save, provide the structured data layer that lets a smaller pilot use pre-built forecasting tools rather than custom-built models.
How long should an AI inventory forecasting pilot run?
Aim for at least one full sales cycle, including a promotional period if possible, so you can compare fill rate, carrying cost and stockouts against a genuine baseline.
What’s the biggest reason AI forecasting pilots fail?
Inconsistent SKU identifiers and fragmented data across POS and ERP systems are the most common cause, which is why centralised, real-time data matters more than model choice.
Is AI forecasting only useful for large retailers?
No. Smaller retail and hospitality businesses often see faster returns because their SKU counts are manageable enough to pilot quickly and their carrying cost savings show up sooner in cash flow.