
Track eight numbers and you can run a sharper business: gross and net sales, transactions, average order value (AOV), items per transaction, gross margin, stock turn and days of supply. Together they answer the questions that keep owners up at night. AOV tells you whether upselling is working. Stock turn tells you whether cash is tied up in shelves nobody’s buying. Sales per labour hour tells you if you’re overstaffed on a Tuesday afternoon. The rest of this guide shows you how to calculate each one and what to do when it moves.
TL;DR:
- Stock turn and days of supply are vital for managing inventory effectively and preventing overstock or stockouts.
- Comparing metrics like AOV and transaction counts should be done against similar periods and controlled for promotions to determine true trends.
- Accurate COGS data is essential for meaningful margin analysis, and manual checks on receipts can prevent costly errors in decision-making.
- Dashboard integration with real-time data, including inventory and staff performance, enables quick responsiveness and better operational insights.
- Focusing on one key goal before measuring changes ensures targeted improvements in areas like waste reduction or revenue per customer.
Table of Contents
- What POS analytics metrics actually measure
- How to read the numbers without jumping to the wrong conclusion
- Turning metrics into decisions: inventory, staffing, pricing and promotions
- Setting up dashboards and data hygiene that you can actually trust
- What good POS reporting looks like in practice
- Where to start with your own POS metrics
- Get the dashboard that makes these metrics easy to check
- Sources
- FAQ
What POS analytics metrics actually measure
Point of sale data captures far more than “what sold.” Every transaction logs the item, price, timestamp, payment method, discount applied, and often the staff member who processed it. That level of detail turns a till receipt into a decision-making tool, which is exactly what makes POS data analysis so useful for spotting patterns retailers would otherwise miss.
Six categories of data feed your metrics: sales, product, customer, payment, staff, and inventory. Miss one category, and you’re working with a partial picture. A café that tracks sales but not staff hours, for instance, can’t calculate labour efficiency at all, no matter how good its till reports look.
Here’s how to calculate the metrics that matter most.
- Gross sales = total revenue before returns, discounts, or refunds. It’s your top-line activity number, useful for spotting seasonal patterns but poor for judging profitability.
- Net sales = gross sales minus returns, discounts, and allowances. This is the number that should anchor every other calculation.
- Transactions = the count of completed sales in a period. Rising transactions with flat net sales usually means smaller basket sizes.
- Average order value (AOV) = net sales ÷ transactions. A £45 AOV in a gift shop tells a very different story than a £45 AOV in a hardware store, so benchmark against your own history, not a generic industry figure.
- Items per transaction = total units sold ÷ transactions. This is your basket-building metric, and it’s the one most affected by till-side prompts and bundling.
- Gross margin % = (net sales − cost of goods sold) ÷ net sales × 100. You need accurate cost of goods sold (COGS) data for this to mean anything, which is where a lot of small operators come unstuck.
- Stock turn = cost of goods sold ÷ average inventory value over the same period. A higher number generally means stock is moving faster relative to what you’re holding.
- Days of supply = current inventory ÷ average daily sales. This tells you roughly how many days until a line runs out at current sale velocity.
Payment splits (card versus contactless versus cash) and staff-level breakdowns aren’t strictly KPIs on their own, but they’re the filters that make every metric above more useful. Segmenting AOV by payment type or by staff shift often reveals patterns a blended average hides completely.
How to read the numbers without jumping to the wrong conclusion
A number moving isn’t the same as a number meaning something. Rising stock turn generally signals healthy sell-through, but it can also mean you’ve simply run out of stock and aren’t reordering fast enough. Falling AOV often points to a missed cross-sell opportunity, though it can equally reflect a shift toward smaller, more frequent purchases that’s perfectly healthy for your category.
Work through KPI changes in this order before acting on them:
- Compare like periods. Weigh this month against the same month last year, not last month, unless you’re checking for a short-term promotional effect.
- Control for promotions and events. A discount weekend will spike transactions and depress AOV. That’s expected, not a trend.
- Check for one-off distortions. A single large B2B order or a bulk return can swing a small business’s weekly averages hard.
- Look for a sustained pattern over three periods, not one blip, before treating a change as real.
- Cross-check against a second metric. If transactions are up but net sales are flat, dig into basket size before celebrating “growth.”
Before any of this, rule out data quality issues. Missing cost data will quietly wreck your margin figures. Split SKUs (the same product entered under two different codes) will understate true sales volume for that item. Refunds miscategorised as discounts will distort both net sales and margin at once.
Pro Tip: Before you make a big pricing or staffing decision off a margin figure, pull ten random receipts and manually check the cost data against your supplier invoices. It takes fifteen minutes and it’s the single fastest way to catch a broken COGS feed before it costs you a strategic decision.
Turning metrics into decisions: inventory, staffing, pricing and promotions
Knowing the numbers is only half the job. The value comes from wiring them into repeatable workflows, and this is where SME operators tend to see the fastest wins, particularly around waste reduction and staffing efficiency, as practical case examples show.
- Inventory: Use sell-through rate and days of supply together to set reorder triggers. A line with 45 days of supply and slowing sell-through is a candidate for a markdown before it becomes dead stock.
- Staffing: Overlay sales-by-hour against sales per labour hour to build rosters around actual demand rather than habit. Many small operators discover they’re overstaffed on quiet mid-week afternoons and understaffed on Friday evenings.
- Pricing and menu engineering: Plot each product or dish by popularity against margin. Items that score high on both are your stars, worth protecting. High-margin, low-popularity items (“puzzles”) need better placement or a price test, while high-popularity, low-margin items (“plowhorses”) often need a portion or cost review. This four-box logic comes from the classic menu engineering matrix, and it works just as well for retail SKUs as restaurant dishes.
- Promotion measurement: Judge any promotion by period-over-period comparison, not gut feel. Track whether AOV rose, whether the lift represented genuinely incremental sales, or whether you simply pulled forward purchases customers would have made anyway.
A POS system built to increase sales usually earns its keep in this exact layer: turning raw transaction logs into the reorder triggers and rosters above.
Setting up dashboards and data hygiene that you can actually trust
Reliable metrics start with a clean dataset. At minimum, your POS needs to capture SKU, cost price, discount applied, employee ID, timestamp, and payment type on every transaction. Skip any one of these and a whole category of analysis becomes impossible later.
A working dashboard typically needs four widgets: real-time sales, product mix, inventory alerts, and staff performance. Dashboards that combine sales, product mix and staff data let a manager spot a slow afternoon and react to it the same day, rather than discovering the pattern in a report three weeks later.
- Integrate accounting software first, since margin data is worthless without accurate cost feeds.
- Sync ecommerce and loyalty platforms next; unifying POS with online sales is what reveals genuine customer lifetime value rather than a single-channel snapshot.
- Set a reporting cadence: daily sales flash reports for managers, weekly stock and staffing reviews for owners, monthly margin and menu reviews for whoever owns pricing decisions.
- Validate monthly by reconciling till totals against the bank deposit and spot-checking COGS on your top ten SKUs.
Retailers using data analytics well have reported it can unlock sustained growth precisely because the hygiene work happens before the analysis, not after.
What good POS reporting looks like in practice
EPOS systems are often built around real-time sales dashboards, multi-store reporting, and product mix tracking that updates as transactions happen rather than overnight. For businesses running more than one till or site, that multi-store view matters more than most owners expect, since it’s the difference between comparing branches properly and guessing.
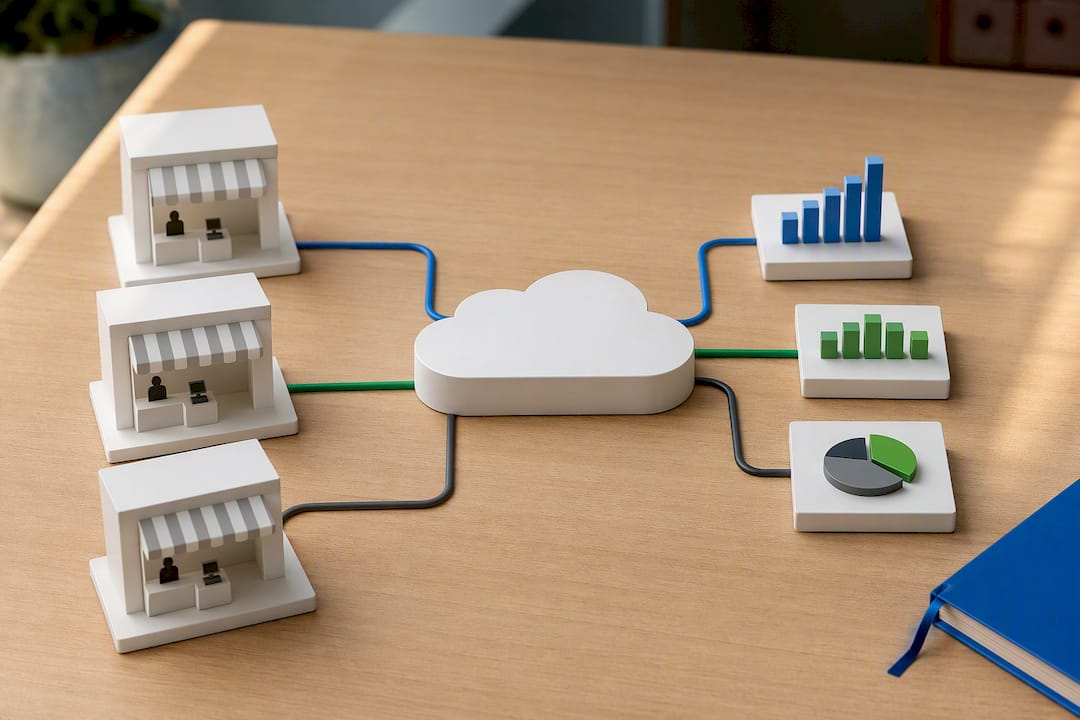
Our retail analytics case study covers how UK shops have used stock and staffing data together over a 90-day window to reduce waste and tighten rotas, which is the same approach outlined in the use-case section above.
If you’re evaluating any EPOS provider, not just Switch-and-save, ask these questions in the demo:
- Can I export raw transaction-level data, or only pre-built reports?
- Which accounting and ecommerce platforms integrate natively?
- Can you show me a sample stock turn and margin report from a business like mine?
This article is written by Amir, whose focus is helping UK retail and hospitality operators make sense of the data their EPOS system already collects.
Where to start with your own POS metrics
Pick one goal, then track only what serves it. If waste is the problem, start with stock turn and days of supply. If revenue per customer is flat, start with AOV and items per transaction. Baseline for two weeks, make one change, remeasure, repeat.
— Amir
Get the dashboard that makes these metrics easy to check
EPOS packages often bundle real-time sales dashboards, multi-store reporting, and support directly with the hardware, so the metrics in this guide can be available in dashboards from day one rather than something built later with a data analyst.

That matters most for the operators this article is written for: a single café owner checking sales per labour hour before writing next week’s rota, or a three-shop retailer comparing stock turn across branches without exporting anything into Excel first. Compare that to the alternative of running your till reports through spreadsheets manually every week. You’ll know within days whether AOV is actually moving after a menu change, because the dashboard is already tracking it. Our retail EPOS systems are built around this real-time reporting, and if you’d rather see the software itself first, the SSPOS software product page breaks down exactly what’s included. Book a free demo and bring one metric you’re currently guessing at. We’ll show you how it looks on the dashboard.
Sources
- Vendion Analytics++ — All data. One place. Zero guesswork.
- POS Data Analytics: 3 Ways to Instantly Boost Profit (Edgeworks)
FAQ
What are the 5 main types of data analysis?
Descriptive, diagnostic, predictive, prescriptive, and exploratory analysis. Most small retailers work almost entirely in descriptive (what happened) and diagnostic (why it happened) analysis when reviewing POS reports.
What are the main types of POS systems?
Terminal-based systems, mobile/tablet POS, cloud-based EPOS, self-service kiosks, and multi-terminal systems for larger sites. Switch-and-save’s bundled hardware and software sits in the cloud-based EPOS category, built to support single and multi-store setups.
Can you give an example of POS data?
A single transaction record showing the SKU sold, price, timestamp, payment method, discount applied, and the staff ID who processed it is a typical example of raw POS data.
How is POS calculated?
There’s no single “POS calculation.” Individual metrics each have their own formula, such as AOV (net sales ÷ transactions) or stock turn (cost of goods sold ÷ average inventory), covered in detail above.